Introduction
In part 1 of this mini-series, we saw how it was a relatively simple task to diagnose and correct the issues preventing an old computer game from starting on modern (Windows 7) systems. This post continues the reverse engineering and patching theme to correct additional runtime issues with Star Trek Armada on modern systems.
Fix #3 – Abnormal Simulation Speed
Once the game was starting correctly, it played just fine on my laptop. When I tried it on one of my family’s desktop machines; however, things were a different story.
On my family’s desktop machine, the simulation speed was all wrong. When the game had only a few objects on the map, ship movement was barely perceptible despite having a very high game frame rate. As objects were added (e.g. via the map editor), ship movement became sporadic, with regular movement becoming randomly mixed in with periods of barely-perceptible movement.
My family’s desktop machine has MUCH more computing power than my laptop. From my background in game programming, I happen to know that these kinds of issues are caused in incorrect assumptions made in the game’s timing logic. When a game simulation does not progress as expected on a fast machine, usually the faulty logic is similar to the following:
1. Get system timer value in milliseconds.
2. Calculate elapsed milliseconds by subtracting previous frame's
   system timer value from the new value.
3. Advance game simulation by the ratio of elapsed time to
   1000ms (1 second).
The problem with this approach is that it relies on a low-resolution unit of time. On modern systems, the elapsed frame time approaches zero (and sometimes becomes zero), which invalidates key timing assumptions made by the game’s developers. It’s easy to fault the STA game developers for using an inappropriate (millisecond-based) timing source, but in this case, it should be noted that in the Windows 95/98 days, using the high-resolution timer (QueryPerformanceCounter and QueryPerformanceFrequency) was notoriously unreliable due to a plethora of motherboard bugs as well as a few issues in Windows. As a result, early Windows game developers often decided on a lower-resolution timer to ensure reliable behavior on most customer systems. (On a side note, for a discussion of how to implement proper timing logic in a modern Windows game, I highly recommend consulting Professor Kelly’s Programming 2D Games textbook.)
Unfortunately, changing a game from a low-resolution timing source to a high-resolution timing source is impractical due to the highly-integrated nature of the timing logic with most of the game engine’s calculations. That said, however, we just might be able to fix the timing problem by adding our own timer logic that slows down the game engine loop enough to ensure that the native timing logic functions adequately.
Debugger Preparations
When debugging a fullscreen game, it helps to take a couple of steps in preparation:
- Add a secondary monitor to your computer.
- Configure the position of the secondary monitor within Windows to be on the left side of your primary monitor.
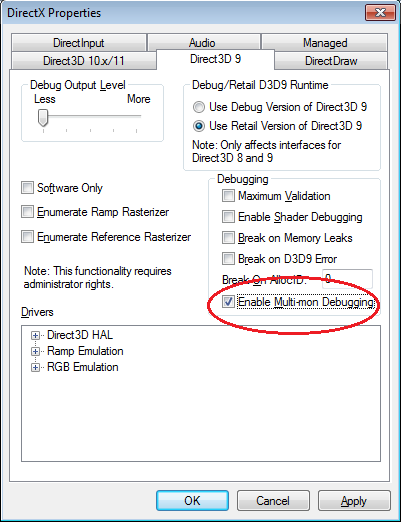
- Enable “Multi-mon Debugging” in the DirectX Control Panel:

Game Preparations
We want to make our job as easy as possible. Doing this means avoiding any special logic that makes the single player levels work (cinematics, triggers, etc). So, we will start a regular single-player ‘instant action’ game and save the game right away. Then, we will load this file whenever we are testing inside Ollydbg.
It is important to note that Ollydbg will be running Armada.exe with the same privileges as those given to Ollydbg.exe. So, since we are running Ollydbg.exe as an administrator, Armada.exe will have Window’s filesystem virtualization turned off. However, since it’s a legacy program, running Armada.exe without administrator rights (say, outside of Ollydbg) would result in virtualization being enabled.
Windows filesystem virtualization is complex, but for us, it simply means is that we need to run Armada.exe as administrator when creating the saved game file that we will use for testing. That way, Armada.exe – when run as administrator by Ollydbg – will be able to find the file we previously created.
Approach
As stated previously, we’re not really interested in fixing STA’s timing logic. Instead, we want to add our own timing logic to slow the game down sufficiently so that the game’s native timing logic will work as originally intended. To do this, we will take the following steps:
- Determine the API function being used to calculate elapsed time.
- Identify the uses of the timing function that are closely associated with the game loop.
- Use the information gathered in part B to find the game loop.
- Make room for new code inside the game loop.
- Write new timing code to slow the game loop down.
- Add the new timing code to the game executable.
A. Determining the Timing Function Used
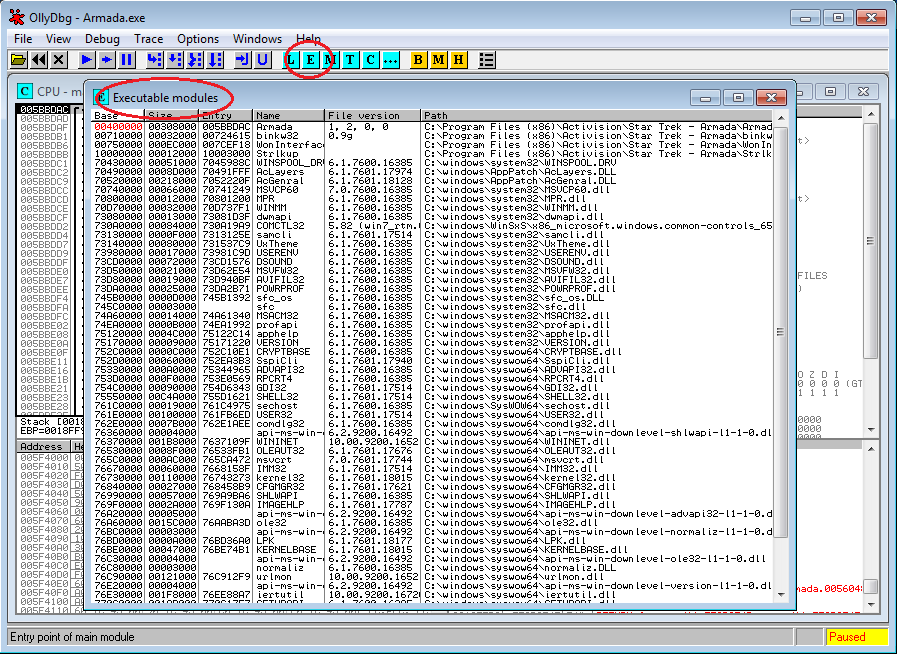
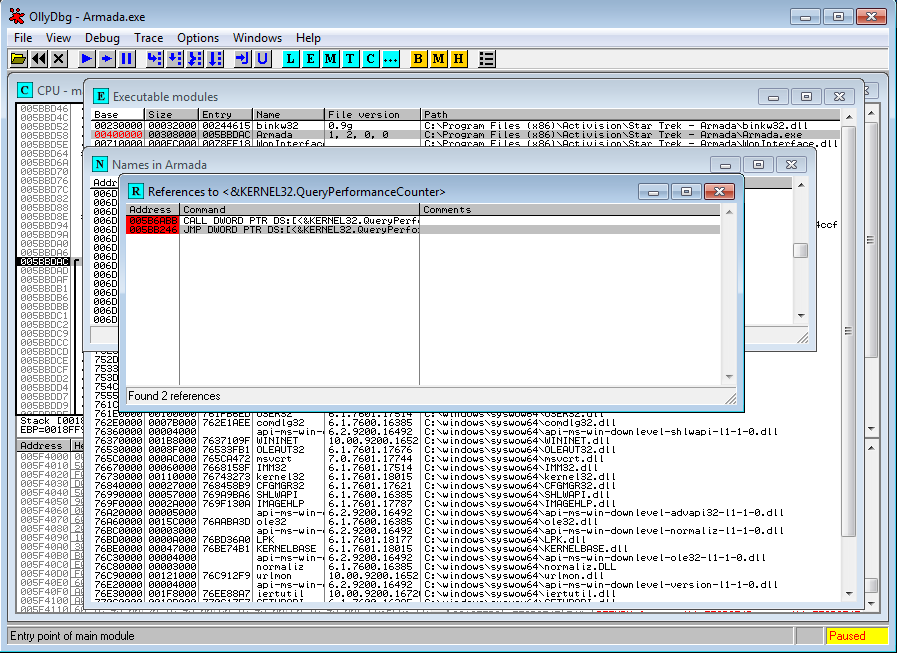
The first thing we need to do is find the timing logic used by the game. To do this, we will fire up Ollydbg, load up STA, and open up the “Executable Modules” window:
(click to enlarge images)
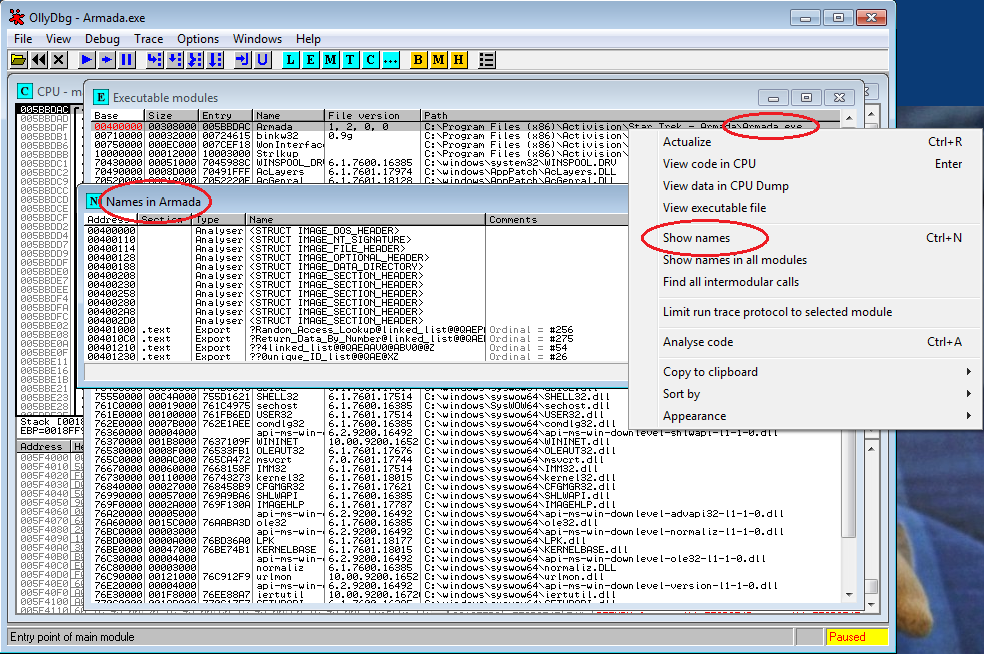
Next, let’s review the imports made by the Armada.exe file (which most likely contains the game loop):
Scrolling through the list it’s pretty large; however we can make our job easier by deciding what to ignore. First and foremost, we can ignore anything not labeled “import”. Secondly, we can ignore any imports from the MSVCRT.dll and MSVCP60.dll files since these are the C runtime libraries (we can do this because the game is most-likely making direct Windows API calls for timing rather than calling any kind of C or C++ platform-neutral API). Finally, we can ignore any DLL entries that are provided by the game itself (such as WonInterface.dll and binkw32.dll). This gets our list down to a manageable size.
Let’s go ahead and do some grunt work to enumerate the possible timing functions. After reading the list, we identified the following candidates:
- KERNEL32.QueryPerformanceCounter
- KERNEL32.GetTickCount
- WINMM.timeGetTime
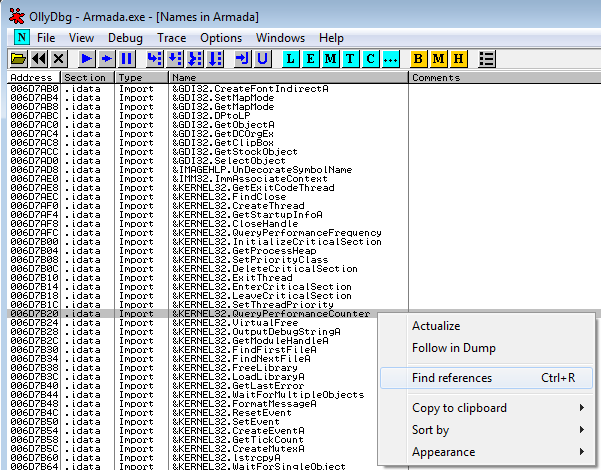
It’s unlikely that the game is using all of these for its simulation timing logic; most likely only one of these is used and we just need to figure out which one. Let’s find all usages in the code for candidate function #1 – QueryPerformanceCounter:
Next, highlight each line and press ‘F2’ to set breakpoints on each use of the function:
Now we can run the game and see what happens. When doing this, it’s important that we actually reach the gameplay stage of the game (i.e. not just the title screen).
…. ( a few moments later ) ….
Hmm, the game runs without hitting our breakpoints. Since game engines require timing input constantly, we must have guessed wrong. QueryPerformanceCounter isn’t what the game engine is using for timing logic.
We’ll delete the breakpoints set on QueryPerformanceCounter and repeat the process for the GetTickCount function.
…. ( a few moments later ) ….
Same result.
Let’s enumerate usages of the timeGetTime function (our last identified possibility):
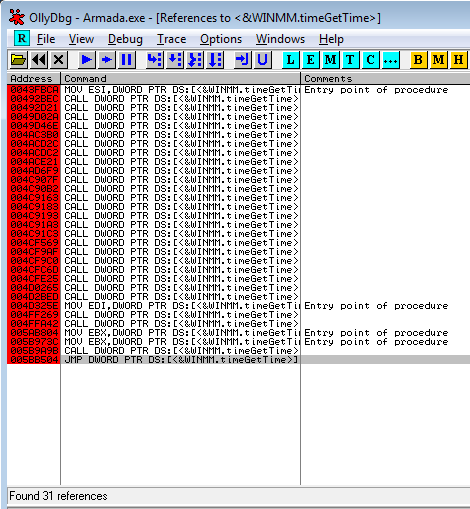
Ugh, 31 references. This may take some trial-and-error. We’ll try running the game with breakpoints set on all of them:
Unfortunately, the game pauses immediately when we try with breakpoints set on all uses of timeGetTime. Let’s try removing enough breakpoints (using trial-and-error) for us to get to the title screen.
(… three breakpoints removed later, we’re at the title screen …)
Let’s try launching the game.
(… five breakpoints removed later, the game crashes. …)
Star Trek Armada is buggy and doesn’t handle minimizing / restoring well. As a result, we’ve crashed the game. On the plus side, due to the repeated calls to the function, we have pretty-much confirmed that STA uses the timeGetTime function for simulation timing.
This function returns time in units of milliseconds, which conforms with our earlier hypothesis about the game’s incorrect behavior being caused by use of an insufficiently granular unit of time.
B. Identifying Uses of timeGetTime Associated with Game Loop
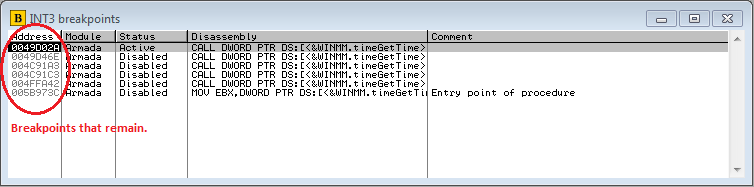
First, we disable all breakpoints. Then, we launch STA and load our saved game. Third, we enable breakpoints on all timeGetTime() usages, like we did before. Finally, as breakpoints are hit, we “disable” them (instead of deleting them) one at a time.
Once the game’s simulation runs without hitting any remaining breakpoints, the ones that we “disabled” are the important uses of timeGetTime. These uses are most likely very near to the game loop in terms of instruction execution order. We can delete any other breakpoints as unimportant:
 `
`This is still quite a list. When we were generating this list, the game was constantly minimizing (and we were continuously restoring it). We should make sure that each of these breakpoints will actually be hit when the game is restored.
To do this, we need to make use of Ollydbg’s breakpoint properties and set a “pass count”:
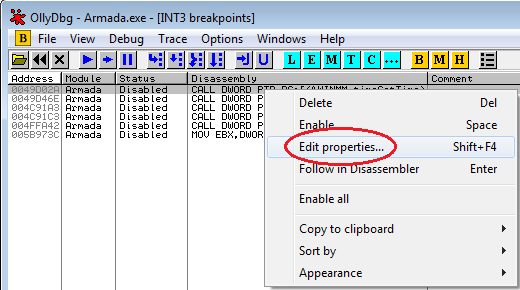
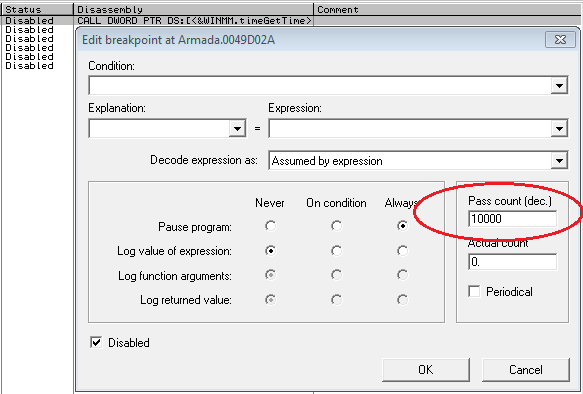
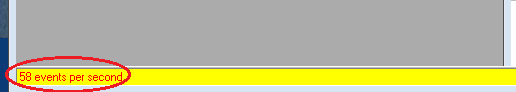
Setting a pass count of 10,000 means that the breakpoint will only pause the program after it is hit for the 10,000th time (or 10,001th … I’m not 100% sure which). With a pass count set, we will enable this breakpoint, resume execution, and then hurry to restore the game from its minimized state. On our second monitor, we will be able to see whether the breakpoint is actually being silently hit or not by watching the Ollydbg status bar:
We will do this one-at-a-time for the six “important” uses of timeGetTime we’ve identified.
(… a few minutes later …)
Aha! It appears that the 004FFA42 breakpoint is not hit when STA is executing normally (i.e. not minimized). We can therefore safely drop this one from our list. We are left with five breakpoints:
C. Finding the Game Loop
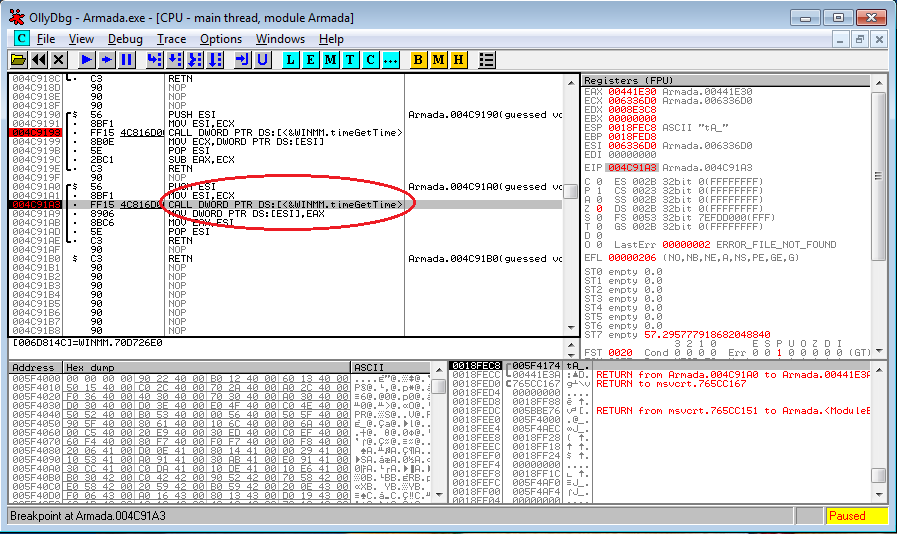
The game loop will likely contain all of the calls to timeGetTime() that we’ve identified. Using the same “pass count” technique, we can retrieve a single “snapshot” of the program’s stack for each use of timeGetTime when the program is running normally (i.e. not minimized). We can then look at the call hierarchy for a common “parent” to each of these timing calls. This common parent will be our game loop.
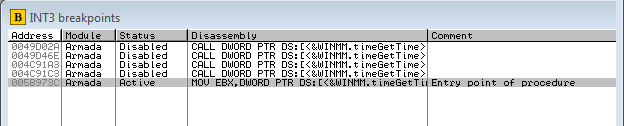
Let’s write down the call hierarchy for each of the 5 remaining breakpoints using the “pass count” approach. The screenshot below partially depicts the call hierarchy for the first use of timeGetTime():
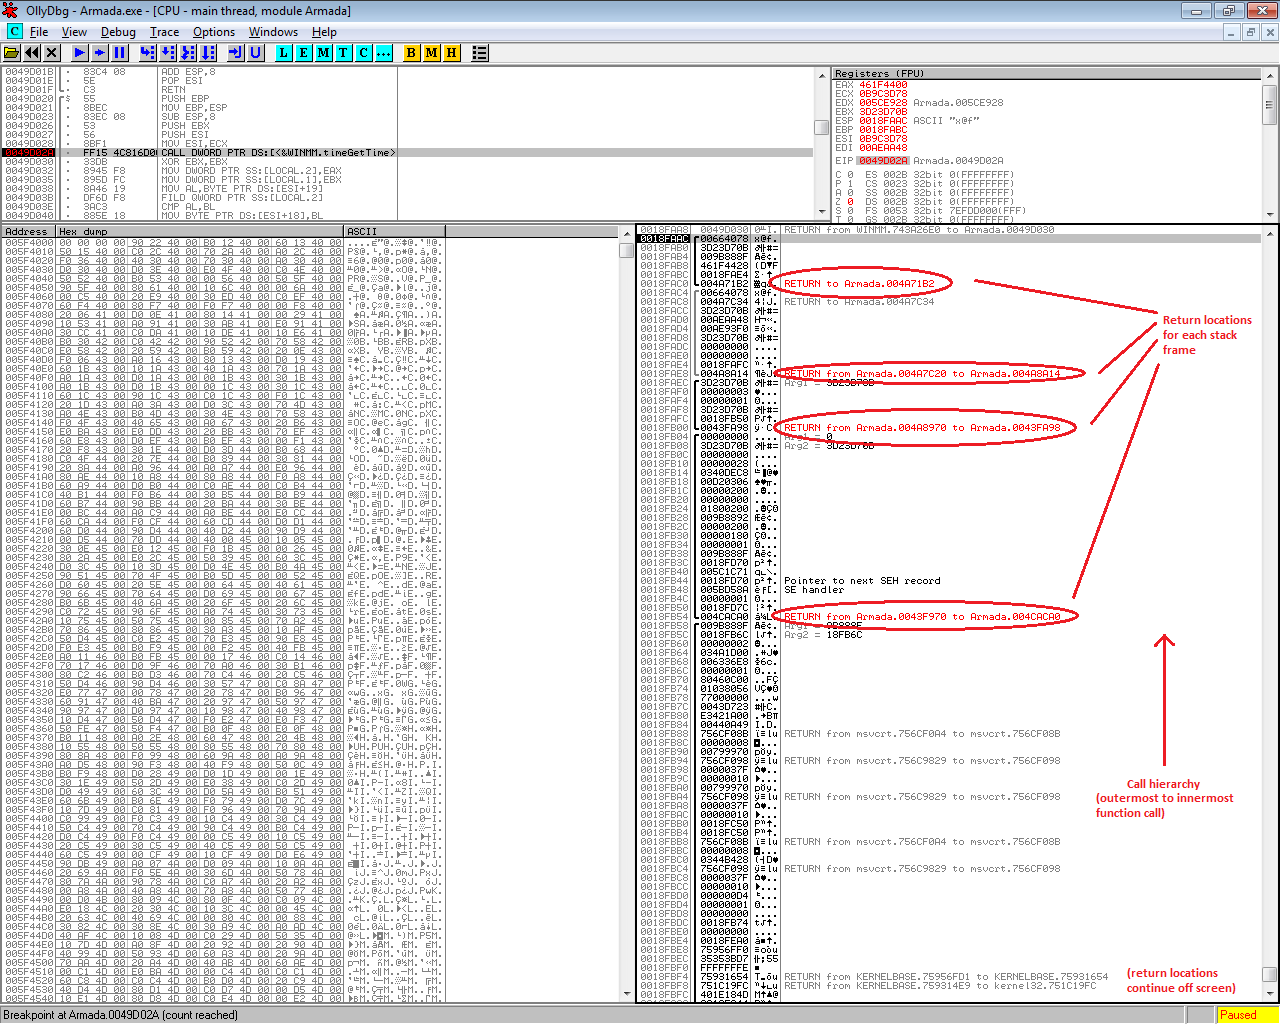
The results of our analysis are summarized in the table below. For each stack frame, we noted the approximate data size (of the frame on the stack) as well as the return address:
| BreakPoint #1 – 0049D02A Frame 1 (small) – 004A71B2 Frame 2 (med. ) – 004A8A14 Frame 3 (small) – 0043FA98 Frame 4 (large) – 004CACA0 Frame 5 (huge ) – 004417E0 Frame 6 (large) – 0043B188 Frame 7 (med. ) – 0043B147 Frame 8 (small) – EntryPt+134 Frame 9 (large) – <Kernel32> |
BreakPoint #2 – 0049D46E Frame 1 (small) – 0047EC4A Frame 2 (med. ) – 0047FC8E Frame 3 (med. ) – 005B97EB Frame 4 (med. ) – 0043FB4C Frame 5 (large) – 004CACA0 Frame 6 (huge ) – 004417E0 Frame 7 (large) – 0043B188 Frame 8 (med. ) – 0043B147 Frame 9 (small) – EntryPt+134 Frame 10(large) – <Kernel32> |
| BreakPoint #3 – 004C91A3 Frame 1 (small) – 0043F993 Frame 2 (large) – 004CACA0 Frame 3 (huge ) – 004417E0 Frame 4 (large) – 0043B188 Frame 5 (med. ) – 0043B147 Frame 6 (small) – EntryPt+134 Frame 7 (large) – <Kernel32> |
BreakPoint #4 – 004C91C3 Frame 1 (small) – 0043FB57 Frame 2 (large) – 004CACA0 Frame 3 (huge ) – 004417E0 Frame 4 (large) – 0043B188 Frame 5 (med. ) – 0043B147 Frame 6 (small) – EntryPt+134 Frame 7 (large) – <Kernel32> |
| BreakPoint #5 – 005B973C Frame 1 (small) – 0043FB4C Frame 2 (large) – 004CACA0 Frame 3 (huge ) – 004417E0 Frame 4 (large) – 0043B188 Frame 5 (med. ) – 0043B147 Frame 6 (small) – EntryPt+134 Frame 7 (large) – <Kernel32> |
Looking at the table above, we notice the following commonality amongst the 5 call stacks:
004CACA0
004417E0
0043B188
0043B147
EntryPt+134
<Kernel32>
It’s likely that our game loop is likely somewhere in this common call stack. Let’s put breakpoints at 004CACA0 and 004417E0 (the top two functions).
(… a few minutes of testing later …)
During regular game execution, our breakpoint at 004CACA0 is hit constantly while the breakpoint at 004417E0 is never hit until we quit the gameplay portion of the game. That means – on the call stack – our game loop is at or below the function containing the 004CACA0 breakpoint but above the function containing the 004417E0 breakpoint.
Let’s examine the code in the 004CACA0 area to see if there are any obvious loops:
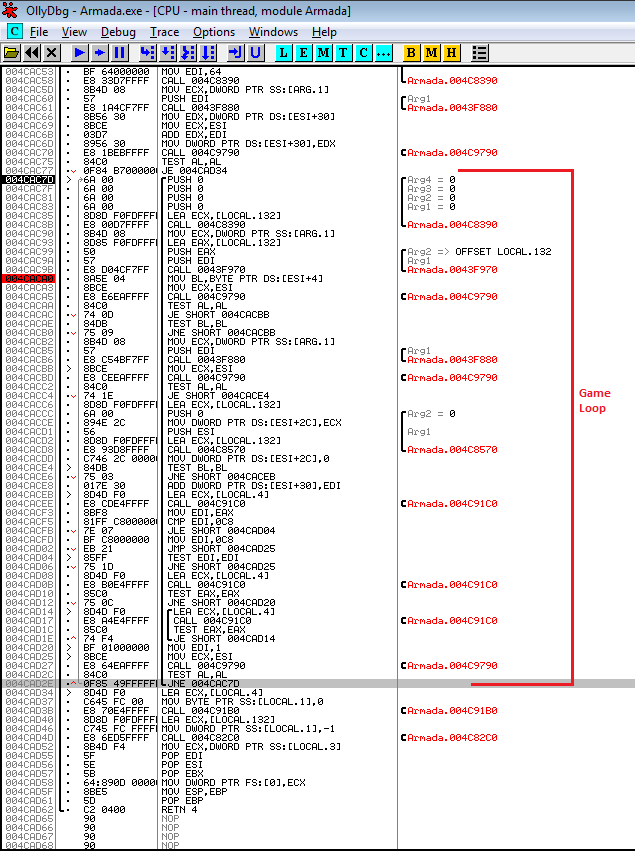
Aha! This looks suspiciously like a game loop! The code executes quite a few calls. Near the end of the function, there’s a final test and a branch instruction which jumps back up to do things over again.
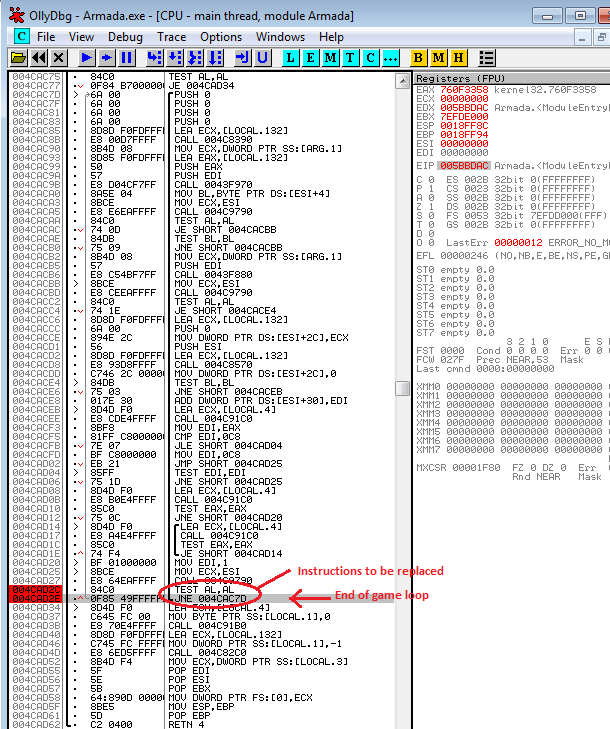
D. Making Room Inside the Game Loop
In order to slow down the game, we need to find a way to make our new code execute during each iteration of the loop we just identified. To do this, we will make a series of patches to the game’s assembly code.
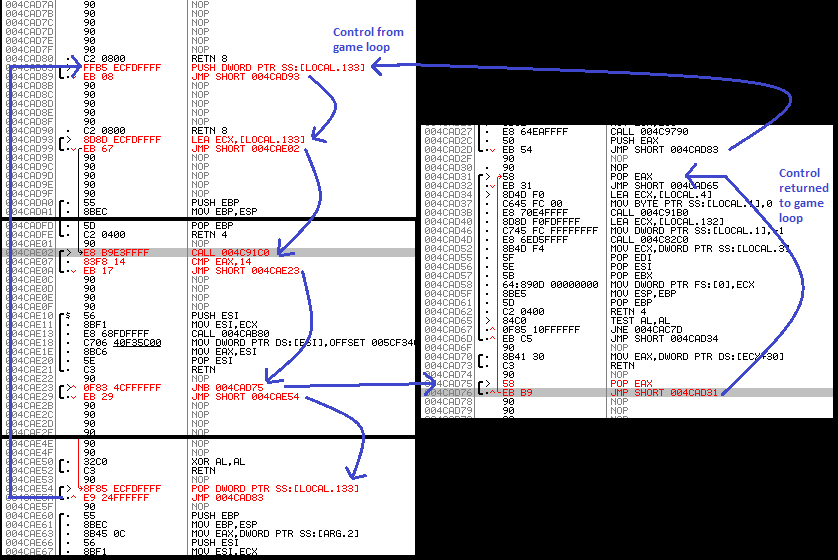
First, we’ll replace the final two instructions of the game loop with our own code that jumps to a new location.
Secondly, we place the original instructions (that we replaced) in an unused location within the game executable. Third, we’ll insert PUSH EAX and POP EAX instructions to save the original result of the subroutine executed by the CALL 004C9790 instruction; pushing the value of EAX on the stack and then restoring it later will allow us to use the EAX register within our new timing code (once we add it) without corrupting the game’s state. Finally, we’ll chain the instructions together with a series of jumps:
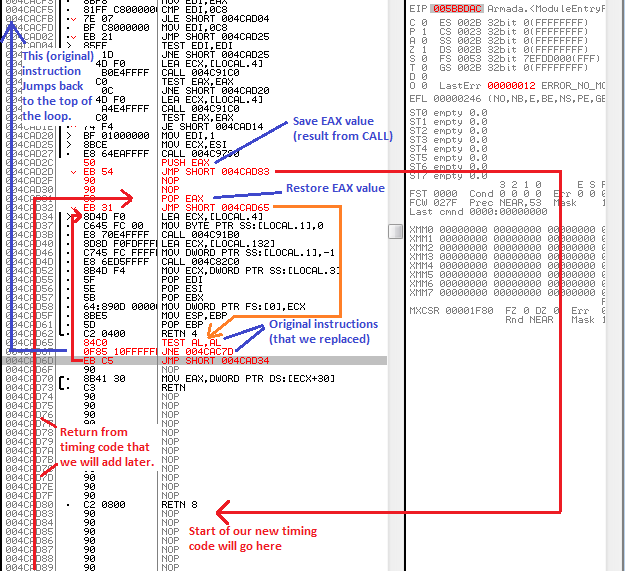
Apologies for the mess; when I originally made these patches, cleanliness was not a goal – I was simply placing instructions wherever there was empty space in the game executable.
We now have control flowing to a new (currently empty) location within the game executable on each iteration of the loop. But, in order to make our timing code work, we’re also going to need a new local variable that persists across multiple loop iterations. As we all know, local variables are stored on the stack and appropriate stack space is allocated at the start of each function.
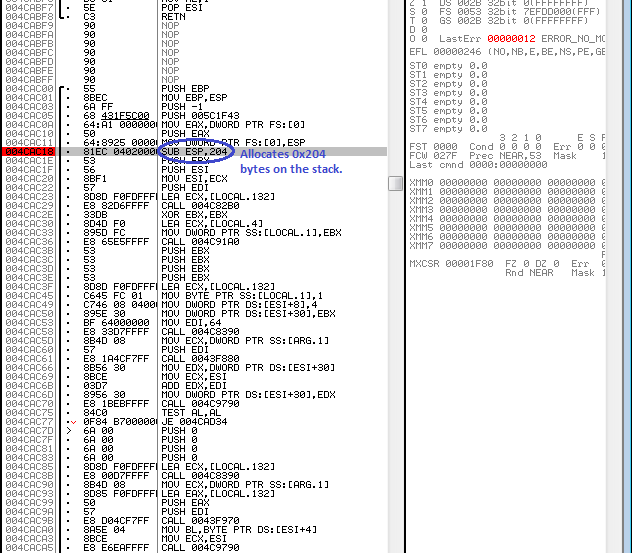
All we have to do is change the subtraction operation applied to ESP (the stack pointer) to increase the space we allocate:
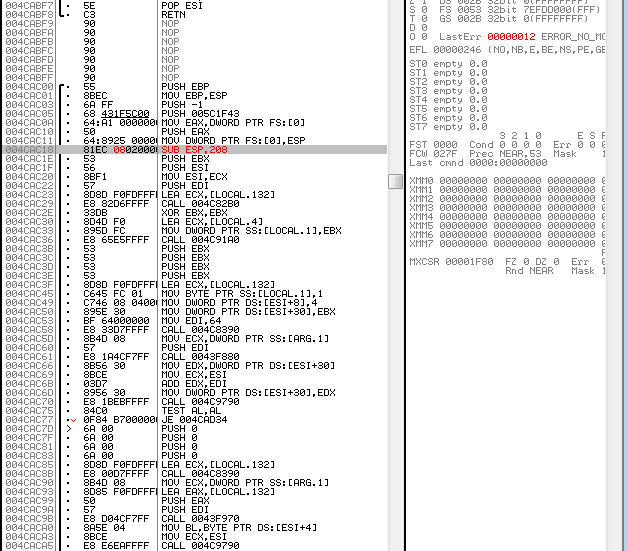
Done. Now we have 4 additional bytes of stack space! This is equivalent to one integer-sized variable.
We now need to think about the memory location of this new stack space. Stack variables are typically addressed using offsets from EBP (base pointer), and our added space will be at the top of the stack space allocated by the SUB ESP,208h instruction. Given this fact, we might think that our local variable space would be at EBP-208h; however, if we look closely at the instructions prior to our SUB ESP,208h instruction, we’ll notice three PUSH instructions, each of which allocate 4 additional bytes on the stack. As a result, we need to subtract (208h + 12) bytes from EBP to calculate the appropriate location. As a result, our new local variable is at location EBP-214h.
E. Writing New Timing Code
Right now, we believe that the use of timeGetTime is resulting in too coarse of a measurement for elapsed time, negatively impacting the game loop’s operation. So, when writing code to slow the game loop down, we need to keep this issue in mind so we avoid a similar error.
While our custom code could – in theory – use the system’s high-resolution timer, doing so would be problematic as a significant number of new instructions would be required; we have limited unused space in the game executable (without changing its size). But, we do have another option – we can create our own small loop that polls timeGetTime until its new result is greater than the last game loop’s result by some minimum threshold – say – 20ms. While this is a CPU intensive solution (we loop, doing nothing, until 20ms has elapsed) it has the benefit of being simple. Furthermore, if we’re clever, we can make use of the game’s existing subroutines surrounding certain timeGetTime calls.
Let’s look at one of the STA routines containing a call to timeGetTime – the routine at 0x004c91c0.
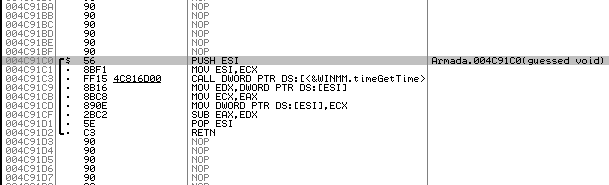
Looking closely at this routine, we can determine that its pseudocode is as follows in C/C++:
DWORD updateAndSubtract(DWORD* time){   // parameter is in ecx
  DWORD newtime = timeGetTime();
  DWORD oldtime = *time;
  *time = newtime
  newtime -= oldtime;
  return newtime;                       // return value is in eax
}
Getting the latest time and subtracting our old time value is exactly what we want to do. Let’s write some pseudo-assembly code that incorporates this existing function into a loop that slows the game down:
  <receive control from game loop>

  ; Stack variable 'time' is at location EBP-214
loop:
  push time       ; save time value
  lea ecx,&time   ; load &time into ecx (parameter for function call)
  call updateAndSubtract
  cmp eax,0x14    ; compare time difference with 20ms
  jnb done        ; if time difference >= 20ms, jump out of loop
  pop time        ; haven't waited long enough - restore original time
  jmp loop        ; repeat until 20 ms have elapsed

done:
  pop eax         ; delete saved time value from stack

  <return control to game loop>
Now let’s convert our pseudo-assembly to true assembly:
  <receive control from game loop>

loop:
  PUSH DWORD PTR [EBP-214]
  LEA ECX,[EBP-214]
  CALL 004C91C0
  CMP EAX,14
  JNB done
  POP DWORD PTR [EBP-214]
  JNP loop

done:
  POP EAX

  <return control to game loop>
F. Adding the New Timing Code to the Executable
Now that we have the code written, all we have to do is add it to the game’s executable. We will continue the trend of adding our code in ‘unused’ locations and chaining the pieces together using JMP instructions:
And with that, we’re done! (Testing showed that this additional code corrected the game’s timing issues on the machine in question.)
Conclusion & a Final Note
Despite the lack of source code for STA, with a little time and reverse engineering know-how, we were able to “hack together” a timing logic workaround for the game. Pretty cool!
One interesting note is that I originally created this patch (minus a few tweaks) a few years back. Upon attempting to reproduce the original faulty simulation behavior this year when visiting my family over Thanksgiving, I was unable to do so; on the desktop machine that experienced the problem, without my patch, the game’s frame rate is locked at 60 FPS, high, but way too low to experience the original timing problems. With the patch, the frame rate is ~46 FPS (close to as expected, since 1000 ms / 20 ms of time wasted per game loop iteration = 50 FPS).
I think this inability to reproduce the original problem stems from the fact that I’ve made a number of graphics changes to the computer over the years. For some reason, the desktop machine is now locking the unpatched game in vertical sync with the monitor’s refresh rate (60 Hz). So, in sum, even if you have a very fast computer, you may not experience problems with Star Trek Armada on your system depending on your graphics set up (and therefore, this patch may be unnecessary for you).
In the final part of this mini-series, we’ll explore one final fix to the game and provide a listing of the patches so that people can implement these fixes on their own copies of Star Trek Armada.